← Back to Blog
HTML Reports in OneStream
Eric Padua·
Been awhile since I've done one of these, but I've been in this limbo of trying to get more clients (I did!), trying to get some form of partner status with OneStream (I'm a development partner!), and I guess just trying to get in the groove of running something and it just being — well, me. But in any case, I thought I'd share something pretty cool that I have been working on (mostly as a prototype, but it's basically ready to deploy at clients).
I think for the most part, if you've ever created "business intelligence" reporting or any form of aesthetic looking reporting out of OneStream, you've probably hit a few snags in the form of:
- Limited options for creativity (making things pretty)
- Trying to use a component(s) in ways that weren't intended just to get your intended look or UX
- A limited amount of visuals that you want to show (or the visual that you're trying to use doesn't do the thing exactly the way you want it to)
All-in-all, a pretty arduous experience — especially if you're trying to do anything fancy with the data — which then comes with the exercise of manipulating data tables in the backend in .NET.
For some context as to why this even came to me as an idea: a long time ago I wanted to be a full stack web/app developer, so I did one of those full stack web developer courses on udemy when they were on sale. The course went through a ton of history on html, why things came to be and why the web is the way it is today, to standing up a web app from scratch with react.
The flexibility that you have in creating websites with html with your specific look and feel is insane. You can quite literally do whatever you want. If you can imagine it, you can build it — there's always a way. And the options that are available to you in realizing your vision are endless.
And since I knew all of this, before I even touched OneStream, the frustration I experienced was also endless — because I knew this was super easy to do if I could just tap into that react framework and plethora of pre-built html components that I was used to.
So after, I don't know, 6 years of doing this, I've put in some time and I created something in OneStream that kind of gets me what I want in the form of canned html report generation with baked in OneStream data.
Basically it works like this:
-
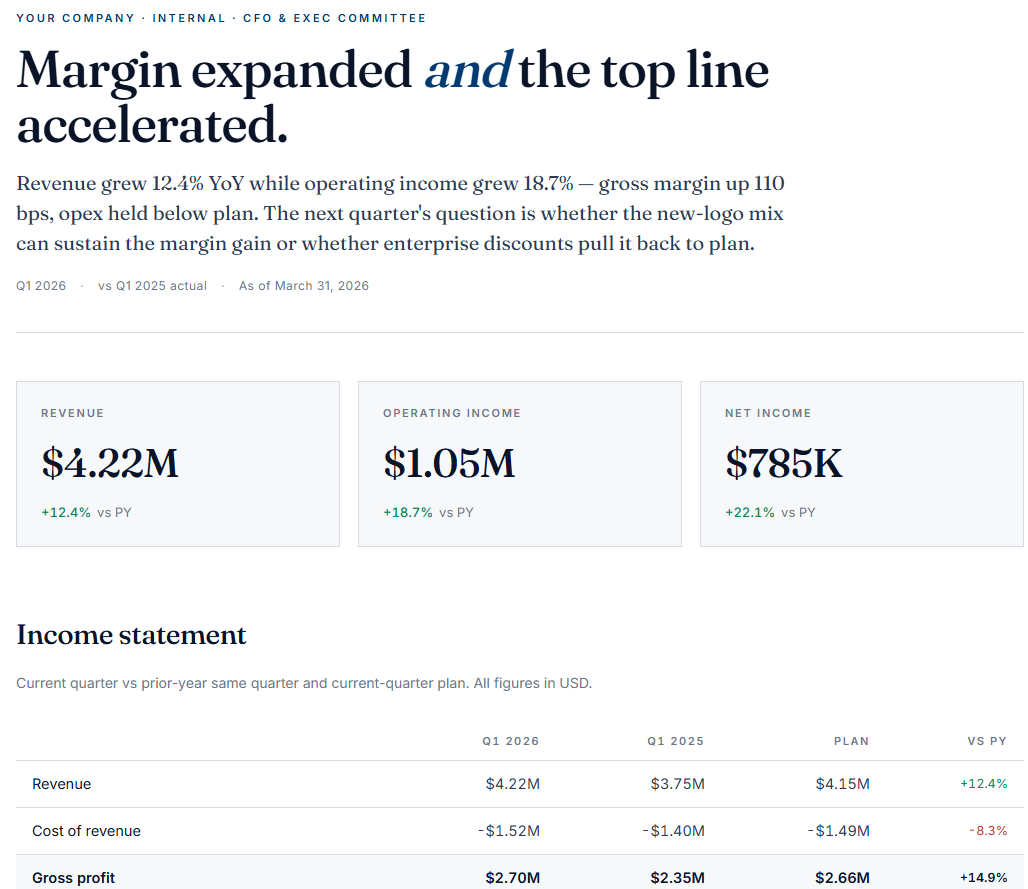
Get a web developer to create a fancy page for you adhering to the system I built (P&L, executive summary, year in review, yada yada) — or you can do it yourself (AI).
-
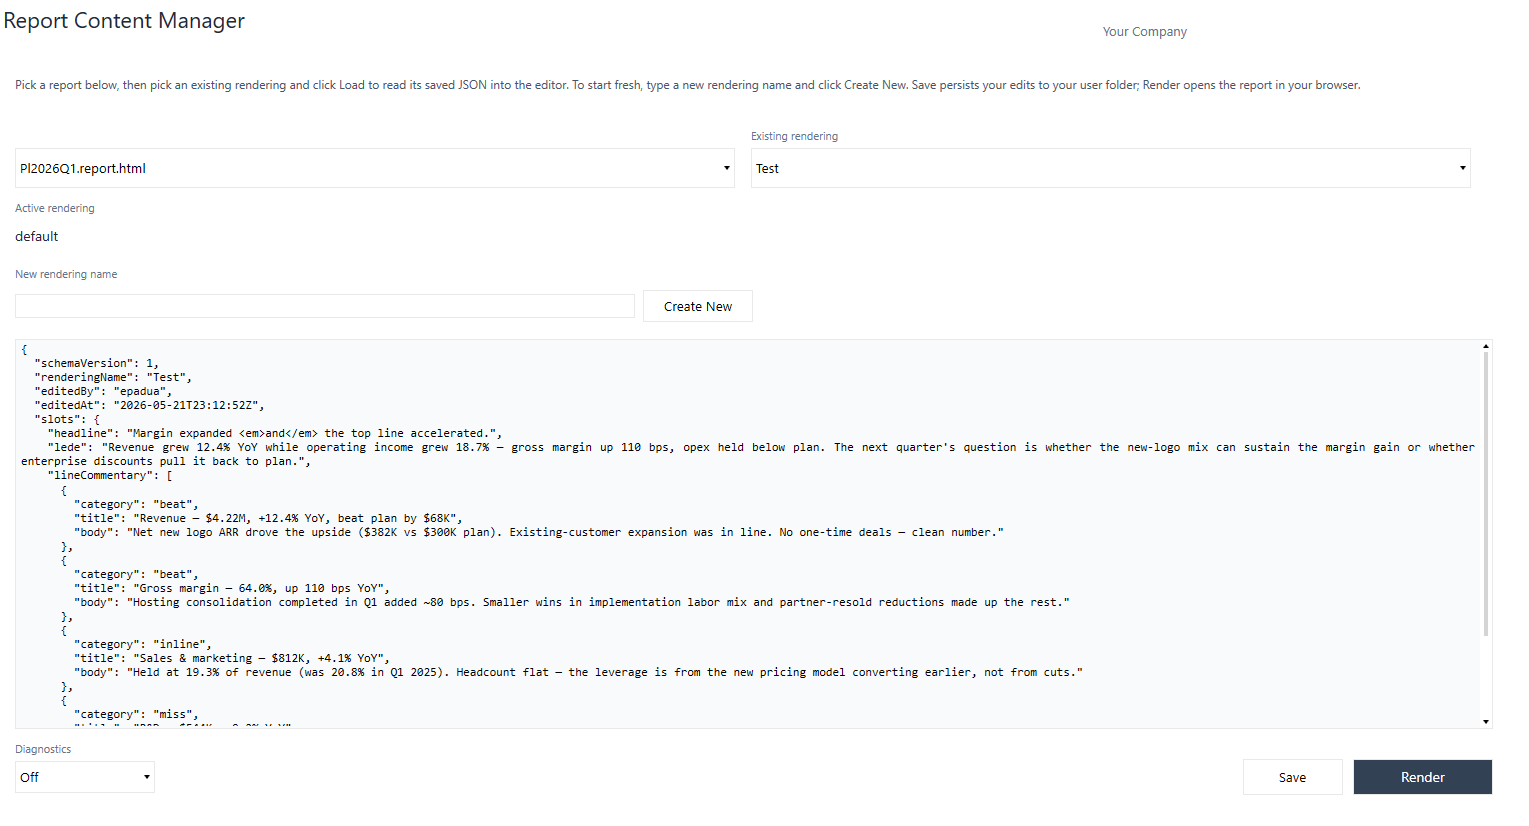
Take that html and upload it to OneStream and inject your data adapter with a cube view attached to it (or anything else you can stick onto a data adapter).
-
Edit some content blocks to change narrative (imagine a quarter to quarter summary).
-
Hit a render button to get your fancy report. That opens up in your default browser immediately.
-
Save the report off and send it to your CFO (or blast it out to a distribution list).
Pretty cool, right? No more worrying about wondering if you can replicate a wireframe a client has given you and what components you would even cobble together to make it look like that.
Now, obviously there are some limitations here.
You can't just go out and build out a whole web application in OneStream — click events don't go through, you can't have the html talk back to OneStream (at least, at the moment you can't), html documents can't be embedded in the web content block inline unless it's hosted somewhere (which is a headache — but maybe OneStream will let me do this in later versions after reading this).
But you can have a nice canned-report experience which is what people want (at least in my experience) after every month close or quarter close. The possibilities here are endless and you have access to world-class visualizations and theming.
In the future, if this type of reporting actually takes off and OneStream beefs up the web content component a little (as well as expands some api functionality), I imagine reports and dashboarding experiences can be driven by fancy html pages almost entirely.
In any case, if anyone reading this likes what they see, feel free to send me a message and we can dry-run this and see what implementing something like this looks like for you.
Oh and also, hopefully I can update this blog a bit more often (sorry).